Abstract:
Rising rates of gun violence has become a severe public health crisis across America. While the media focuses on mass shootings, the plague of firearm-related homicides and assaults stretches far beyond the heinous incidents that catch the attention of the American public. The purpose of this paper is to conduct a comprehensive regression analysis aimed at identifying the key determinants of gun violence in the United States. In 2022 alone, there were more than 40,000 incidents of criminal gun violence resulting in almost 20,000 fatalities across the nation. With politically divided and motivated statements of causation dominating the news cycle and social media platforms, often without any grounding in scientific or data-driven facts, it is imperative to gain a deeper understanding of the true factors that contribute to this pressing issue. My goal is to enhance public awareness by presenting the statistical findings in a comprehensible, easily understood manner, ensuring that my research can be utilized by professionals, researchers, and policy-makers to objectively examine the plague of gun violence and use data-driven decision-making to create policies that effectively deal with this public health crisis.
Key Findings:
Although gun safety laws, also known as gun control measures, have been on the rise over the last decade with the overall United States experiencing a greater than 55% increase in the number of laws, a few states have chosen to eliminate nearly all of their gun laws, with Mississippi and Georgia leading the charge by reducing their gun safety laws by ~50%. At the same time, many states have legislated a sharp increase in gun regulations, led by Colorado which tripled its gun safety laws, adding 21 to the books over the 8-year period. Also during this time period, 22 states have eliminated the requirement to obtain a permit in order to carry concealed pistols, bringing the number of these states who have “Constitutional Carry” from a mere 5 up to 27, more than half the states in this country. My objective with this study was to see if states that increased their gun safety regulations experienced less gun violence than those that maintained or decreased their laws, and to see if there was an adverse effect to removing the licensing requirement for concealed carry. My research found that there was no statistically significant effect on the rates of gun violence by either implementing gun safety laws, or by removing the licensing requirement for concealed carry. In fact, states that implemented more gun safety regulations tended to have increased incidents of gun violence, though the data failed to rise to any level of statistical significance.
Conclusions:
I gathered data on six independent variables for this study: number of gun safety polices, poverty rate, concealed carry permit rate, the adult prevalence of mental illness, the unemployment rate, and the population density of the state or district and regressed these against the dependent variables of both total incidents of gun violence by state, and gun violence by state per capita. Of these variables, the only one that remained statistically significant throughout all of the regressions was the poverty rate. To analyze these variables, I designed and ran four regression models. The first model is a partial model testing for both unconditional and conditional convergence between states with different initial steady-state gun violence rates. This model was meant to test if states with lower incidents of gun violence in 2014 tended to converge with states with higher incidents of gun violence. The unconditional model tested only those variables while the conditional model controlled for gun safety regulation, the poverty rate, the mental illness rate, and unemployment. My expectation was that there would be convergence between these states as the tendency for states with lessor incidents of gun violence in 2014 was to reduce gun safety legislation and implement Constitutional Carry, while the tendency for states with higher initial gun violence rates was to increase gun safety laws. I found that instead of the expected convergence, the unconditional model found divergence between these states, though the magnitude of the divergence was very small at .01796. The conditional model which controlled for the several variables listed above found a very small convergence effect with a magnitude of -.0036.
The second regression model is a partial model testing for the effect of changes (increases or decreases) in gun safety laws. In this model, I stacked gun safety regulations and gun violence incidents from both 2014 and 2022, and added a dummy variable with 0 and 1 representing 2014 and 2022 respectively. The regression resulted in the “year” dummy variable showing a coefficient of 241.77. The positive coefficient indicates that gun violence levels in 2022 (dummy=1) are higher by 241.77 cases compared to 2014 levels (dummy=0 baseline) after controlling for differences in gun safety laws. This model also found that a one unit increase in the strictness of gun safety laws is associated with a predicted INCREASE of 19.666 gun violence fatalities (p=0.003), a statistically significant effect controlling for other factors.
The third model is another partial model testing for the effect of the increase in states with Constitutional Carry laws. Prior to 2014, five states had implemented concealed carry without a permit (AK, AZ, AR, VT, WY). Between 2014 and 2022, 20 additional states implemented this law. There are two states (FL, NE) that have implemented Constitutional Carry in 2023. To test only the 20 states that implemented this regulation in the intervening years of interest, I set the listed seven states to the dummy variable of zero to maintain consistency with the tracking data. For this model, I took the natural log of the difference in gun violence between 2014 and 2022, and, using that as the dependent variable, I ran a regression with the natural log of the base year (2014) as the explanatory variable in order to turn the coefficient into a growth rate. Using Constitutional Carry as a dummy variable with only the 20 states of interest set to 1 and the remaining states set to 0, the model showed a coefficient of .00938 on the variable log(GV2014), indicating a growth rate of effectively zero, with a 95% confidence interval of -.04974 to .06851 and an R-squared of 0.0061. This model showed that implementing Constitutional Carry had almost no effect on gun violence rates in those states.
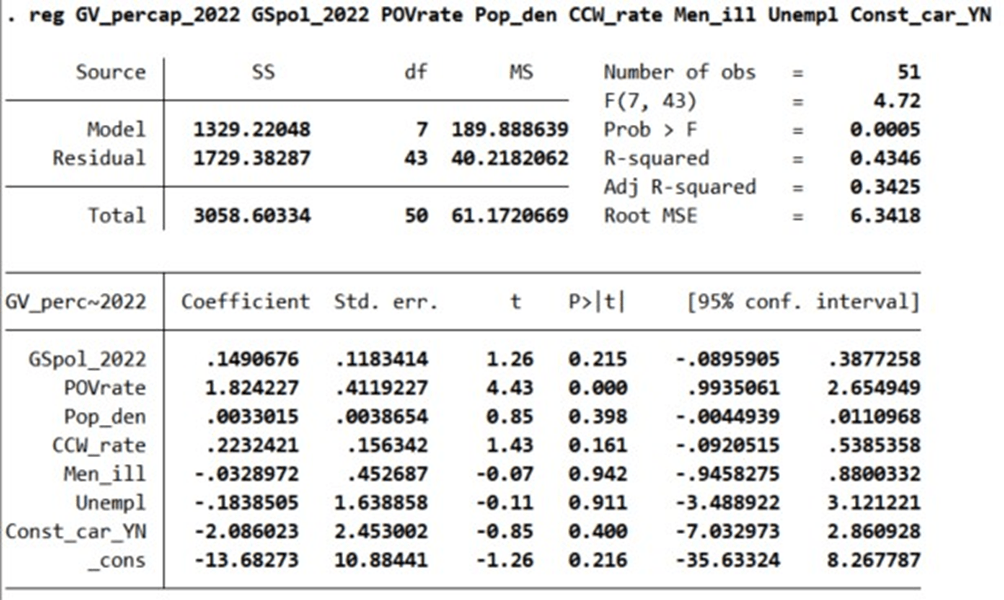
The fourth model is a complete model regressing all six explanatory variables plus a dummy variable for Constitutional Carry against the dependent variable “Gun violence per capita in 2022.” The model has an F-value of 4.72 and a Prob > F of 0.0005 making the model statistically significant at an alpha of .01 (three stars). The R-squared for the full model is 0.4346 indicating that it explains more than 43% of the determinants of gun violence. Of all the regressors, the only one that is statistically significant at any recognized alpha level is the poverty rate with a P > t value of 0.000 (three stars). The coefficient on the poverty rate is 1.824, implying that every 1.824 increase in the per capita poverty rate is associated with a 1-point increase in the per capita gun violence rate, a result that comes with little surprise. The coefficients on gun safety policies, population density, and the concealed carry permit rate were all positive implying that an increase in each of those is associated with an increase in gun violence, though none were statistically significant at any recognized level of alpha (0.215, 0.398, and 0.161 respectively).
The conclusion derived by the models is that increasing gun safety policies does not have a statistically significant negative effect on gun violence rates, and that states that have implemented Constitutional Carry laws have seen no statistically significant increase in gun violence rates greater than those that have not. According to this model, if America wishes to decrease gun violence rates, the most significant efforts should be directed toward reducing the rate of poverty.
Introduction:
Gun violence in America has risen dramatically over the past decade. Between 2014 and 2022, total incidents of gun violence increased by 74.5%, from approximately 25,500 shootings in 2014 to 44,200 shootings in 2022. During that same time period, states increased laws designed to protect against gun violence by an unprecedented 55.2%, from 627 total laws in 2014 to 949 in 2022. These gun law changes were not equally distributed among the states, however. States like Colorado, California, Illinois, Oregon, and Washington implemented significant increases in the number of gun safety laws on their registers, while other states, led by Arkansas, Georgia, Mississippi, and Oklahoma actually decreased the number of gun laws governing firearm ownership and usage in their states.
Much of the attention on incidents of gun violence by both the media and policy-makers is focused on mass shootings, typically defined as four or more dead including the shooter. However, this heinous act, while drawing the attention and wrath of the public, accounts for only about 1% of all gun violence incidents. The overall plague of gun violence is not well represented in the number of mass shootings. The focus of efforts to decrease gun violence in general should have an adverse impact on mass shootings as well, yet most of the policy measures implemented by state legislatures are instead focused on controlling this one-percent event.
There exists in this country a polar divide between liberal and conservative lawmakers on how to handle the gun violence problem. Policymakers on the left are convinced that gun safety legislation and gun control acts will decrease gun violence, while policymakers on the right are convinced that gun violence is a criminal problem brought on by weak prosecution and lax application of law and punishment by liberal prosecutors and a weak criminal justice system. Very little usage is made of the data available on gun violence, and much of that data is misleading or compiled in biased fashion. Most data on gun violence includes instances of suicide by firearm, accidental deaths, and police legal intervention, and these inclusions skew the actual problem of criminal firearm violence that is plaguing the community. Suicide by firearm alone makes up the majority of gun violence in this country, with suicides accounting for 56% of all firearm deaths. While suicide is a serious problem, it is a separate problem from the plague of gun violence, and as such, should be removed from any data sets analyzing firearm violence.
Gun violence continues to inflict devastating costs in lives lost across many parts of the United States. Over recent decades, debates have intensified over potential policy and legislative strategies to curb firearms deaths. Some advocate for stricter state limits on gun purchases, possession regulations, and investing in prevention programs. Others argue additional restrictions fail to impact violent offenders while impeding the rights of law-abiding gun owners.
Disentangling the complex linkages surrounding gun policies remains imperative but challenging. This study seeks to provide state-level empirical evidence using data regression models evaluating the direction and degree of association between, among other things, stricter gun safety legislation and gun violence rates from 2014 to 2022. Controlling for underlying socioeconomic drivers such as poverty, unemployment, and mental illness rates, this study will test for the factors that influence the rising rates of gun violence. Understanding the trajectories of firearm-related deaths amidst a patchwork of diverging state laws stands essential to move towards solutions balancing individual rights with violence prevention. This analysis investigates the role legal restrictions may play in shaping overall gun violence outcomes across locales providing longitudinal evidence integral to an issue central to public safety and public discourse alike.
Organization:
In this paper, I’ll first discuss the related literature and studies done in the past. The study of the determinants of gun violence has been attempted by numerous scientists in a wide variety of fields. As gun violence grows, trying to solve why it occurs becomes ever more crucial. This paper will examine some of the related studies and the polar conclusions that have come from these varied efforts to understand this phenomenon. I’ll then explore the explanatory variables that I’ve determined are most likely to be important in determining causation for gun violence. After discussing the meaning and significance of the explanatory variables, I’ll go over the models I’ve run.
For this study, I’ve chosen four models that I felt were the best explanatory models for the regression variables. While these four models only begin to scratch the surface of this serious problem in America, they do bring some surprising conclusions that I’ll discuss in depth. Following the outline of the models, I’ll go over the data that I compiled to prepare this paper. This data, grabbed from numerous sources and checked carefully for reliability and accuracy, is extensive but not necessarily thorough, a problem I’ll address in the conclusion. The data and descriptive statistics section will have tables showing the variables and their ranges, followed by a matrix and some scatterplots showing the level and magnitude of correlation between the variables, and then looking at the statistical significance of both the regressors and the models themselves.
Finally, the paper will conclude with a discussion of the purpose of the study, the key findings, the policy implications, and some suggestions of where we need to go from here.
Related Literature:
There have been numerous previous studies regarding gun violence. The Rand Corporation (Rand, 2018) has compiled a list of many of these studies into the determinants of gun violence. One such study by John Lott and David Mustard, (Lott and Mustard, 1997) found that states that had “shall-issue concealed carry” laws observed a decrease in violent crime, murders, rapes, and assaults. Lott would partner with John Whitley and Florenz Plassman a few years later, (Lott and Whitley, 2003) to confirm these findings, specifically that an annual reduction in murder rates between 1.5 and 2.3 percent occurs for each additional year that a right-to-carry law is in effect. Ian Aryes and John Donohue, publishing in the Yale Law School Repository, found that shall-issue states saw an increase in more crime categories than saw a decrease (Aryes and Donohue, 2003), a finding that Lott and Whitley found great fault with, and Donohue alone later found that effects were mixed and sensitive to model specifications and data (Donohue, 2003). According to Rand, nearly all of the early studies into the analysis of shall-issue states failed to control for serial correlation in the panel data set and that led to gross exaggerations of the statistical significance of the study results while elevating the risk of finding effects that were in the opposite direction of the true effect (Rand, 2018).
Mark Gius published a study in the Royal Statistical Society in 2014 that showed that assault weapons bans have no statistically significant effect on gun-related murders, and that permissive concealed carry laws may actually reduce gun-related murders. Gius found that states with more restrictive concealed carry laws had gun-related murder rates that were 10% higher than those states that had less restrictive laws (Gius, 2014). In 2013, Michael Siegel, Craig Ross, and Charles King published a study for the American Public Health Association that found that there was a robust correlation between higher levels of gun ownership and higher firearm homicide rates, although they were not able to determine causation in their study. (Siegel, et al, 2013)
There seems to be little doubt that although there have been dozens of these studies all with similar goals and supposedly similar data sets, much of the research into this phenomenon has been flawed or biased in one way or the other. Inclusion of suicide statistics, accidental deaths, and legal intervention, along with misinterpretations of causation have created flaws in many of the research to date. While it likely exists, I was not able to find any regression analysis using the same or similar explanatory variables to the ones I’ve used for this study.
Descriptive Statistics:
Table 1
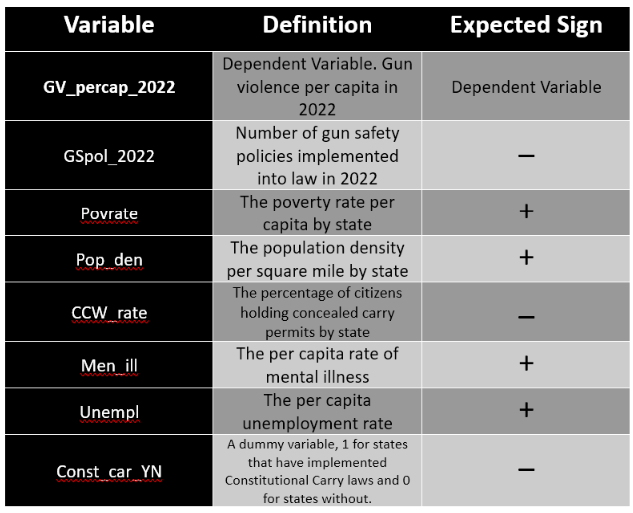
Table 1 shows the descriptions and sign estimates for the variables in my analysis. When looking at gun violence per capita, I’ve collected numbers for all fifty states plus the District of Columbia. The first variable is gun violence per capita in 2022. This is the dependent variable, and the variable for which I’m attempting to find the determinants. The first explanatory variable is the number of gun safety policies by state in 2022. States have the Constitutional right to decide the relative strength or weakness of their own gun laws provided such laws do not violate the Second Amendment to the U.S. Constitution. As such, there is wide disparity in the number of gun safety policies legislated into the laws of each state. For this study, I identified 54 possible gun safety or gun control laws that are present in the laws of the various states. The implementation of those potential laws is widely disparate, with a minimum of just three in Mississippi, to a maximum of 45 in California. These various laws and policies include things such as a ban on “assault weapons,” a ban on high-capacity magazines, background checks, waiting periods for firearm purchases, minimum ages to purchase a handgun, whether or not firearms are allowed on school grounds, in bars, or in state buildings, seizure laws for domestic abusers and felons, castle doctrine, duty to retreat, gun-show loophole closures, and many more. The expected sign of the coefficient for this variable is negative as I expect that states that have taken the greatest efforts to control firearms will see the lowest number of incidents of gun violence per capita.
The second regressor is the poverty rate per capita. This ranges from a low of 7.42 in New Hampshire to a high of 19.58 in Mississippi. As I anticipate that higher poverty is correlated with higher rates of crime, the expected sign of the coefficient for poverty rate is positive. The third regressor in the chart is the population density. Population density ranges from a low of 1.3 persons per square mile in Alaska to a high of 11,295 persons per square mile in Washington D.C. The second highest population density in the United States is in New Jersey, with a density of 1263 people per square mile, making the Washington D.C. figure an outlier in the data. In addition to this outlier, Washington D.C. also showed an outlier in gun violence per capita with a number of 105.388, with the second highest rate being Louisiana at 37.035. To avoid skewing the data with these outliers which are genuine values and not data errors and should be included in the regressions, I chose to treat them by trimming them both under the Winsorisation approach. As I anticipate that more dense populations provide for more opportunities for crime, the expected sign of the coefficient is positive.
The third regressor in the list is the rate of concealed carry licenses issued in the state. States that license their citizens to carry concealed weapons vary widely between “shall issue” and “must issue” states, and courts have repeatedly held that denial of a permit to carry a concealed pistol must be accompanied by specific and justifiable reason. Some states make it very easy to obtain this license, and some make the process as arduous as possible while attempting to avoid being sued. This permit issuance rate varies quite widely from 0% in Vermont and Hawaii up to 32.5% in Alabama. Hawaii issues very few licenses and essentially requires that permit applicants provide a valid reason and qualifiable necessity that has yet to be challenged, while Vermont is at 0% simply because the state has never required a permit to carry a concealed firearm, and thus has never issued such permits. The sign of the coefficient on this variable is rather tricky to estimate as there are two very reasonable schools of thought. The first is that more people carrying concealed firearms makes it less likely that criminals will engage in firearm violence knowing that citizens around them are more likely to be armed and willing to engage them. In this case, I would expect the sign of the coefficient to be negative. However, the other reasonable school of thought is that more people carrying concealed firearms equates to more guns in public and therefore more opportunity for gun violence to occur, a scenario where a positive sign on the coefficient would be expected. For this paper I have estimated that the first scenario is more likely than the second as criminals intent on firearm violence are not dissuaded by laws requiring them to obtain a license, but that beneficent individuals who might stop such gun violence will tend to follow the law and therefore may not be armed without a permit, depending on how arduous the permitting process is. Therefore, the expected sign of the coefficient here is negative.
The next variable is the rate of mental illness. Although I expected mental illness rates to have very little deviation among states, there is significant disparity. The per-capita rate of diagnosed mental illness ranges from a low of 16.37 in New Jersey to a high of 26.86 in Utah. I have anticipated that much gun violence is a result of mental illness, and thus have assigned the expected sign of the coefficient to be positive.
The unemployment rate of the state is the next regressor, and I’ve estimated the sign of the coefficient to once again be positive. The more unemployed people a state has, the greater the chance of gun violence through either necessity or ennui. I also anticipate that unemployment leads more often to increased gang affiliation, particularly among the youth, and since gun violence and gangs are likely to be correlated, I anticipate higher unemployment rates leading to higher incidents of gun violence.
The final coefficient on this list is a dummy variable representing whether or not the state has implemented Constitutional Carry laws—the right to carry a concealed firearm without a state-issued license. For the same reasons outlined in the variable for the rate of concealed carry licenses issued by states, I anticipate the expected sign of the coefficient here to be negative.
Models:
Model 1
Due to the complicated nature of this study, I’ve identified four regression models to use in the analysis. The first is a two-part, partial model that tests for both unconditional and conditional convergence between states from 2014 and 2022. I want to see if states with lower initial levels of gun violence tend to converge with states with higher levels of gun violence both with and without controlling for other factors such as gun safety laws and socioeconomic concerns. For model 1A, I used a log-log model where I took the natural log of the difference in gun violence by state between 2014 and 2022 and regressed that against the natural log of the steady-state gun violence rate in 2014. The model equation is as follows:

where Y is the natural log of gun violence in 2022 minus the natural log of gun violence in 2014, and X1 is the natural log of gun violence in 2014. The regression results are:
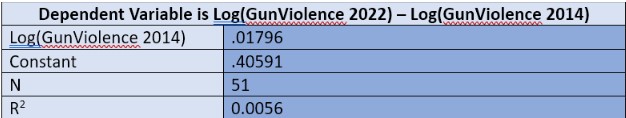
In this regression model, convergence between states with lower initial levels of gun violence and those states with higher levels is indicated by a negative coefficient on the natural log of the initial level in 2014. Here we see that the coefficient is actually positive, indicating that we have divergence between these states. The coefficient itself however is close to zero with a value of .01796, meaning that the divergence is marginal if it exists at all. This model tests for unconditional convergence without controlling for any conditional differences in state demographics or efforts toward gun violence prevention. The next model looks at convergence in a conditional sense, controlling for these variables. The equation of the conditional convergence model is:

where ln Y is again the natural log of gun violence in 2022 minus the natural log of gun violence in 2014, and X1-X5 are the natural logs of the regressors. The regression results are:
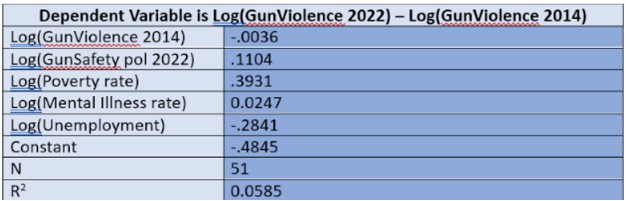
In this model, we see evidence of conditional convergence indicated by the negative coefficient on the variable the initial rate of gun violence in 2014. However, similar to the previous model, the magnitude of the coefficient is very close to zero, even closer to no effect in this model with a measurement of -.0036. This magnitude is small enough that there is little confidence in the statement that states with lower initial levels of gun violence tend to converge with states seeing higher initial levels.
Model 2
Model 2 is a partial model examining the effect of gun safety laws, otherwise known as gun control laws, on the rates of gun violence. For this model I’ve used data from 2014 and from 2022 on both gun safety laws and gun violence. During this eight-year period, gun violence has increased by 74.5% while gun safety policies across the nation have increased by 55.2%. In 2014, American states had a total of 627 gun control laws, a number that grew to 949 in 2022 mostly due to an increase in high profile mass-shooting events like the Aurora theater shooting in Aurora, Colorado in 2012 that killed 12 people, the Orlando nightclub shooting in 2016 that killed 49 people, and the Route 91 Harvest Festival shooting in Las Vegas in 2017 that killed 60 people.
For this database, I relied on gun safety laws identified by Giffords Law Center to Prevent Gun Violence, a non-profit organization that has a charter to prevent gun violence. Giffords scorecard methodology is detailed and transparent, and although their grading of states may be biased, their sourcing of historical data on state law changes is sound. Giffords has identified state gun laws in several policy areas such as background checks, weapons bans, sale and transfer regulations, gun owner accountability, consumer safety, guns in public, and investigative tools for gun violence. In total, Giffords has identified 54 potential gun control laws currently on the books in at least some states. (Giffords, 2022)
Gun control measures have not been uniformly implemented by states, and some states have in fact reduced the number of gun safety laws during this time period. Eleven states in total either reduced or maintained the number of gun control laws between 2014 and 2022, led by Mississippi which had six gun safety laws in 2014 and only three in 2022, a 50% reduction. The remaining 39 states plus Washington D.C. all increased the number of gun safety laws during this time period, led in total number of new laws by Colorado which added 21 laws, and in percentage of new laws by Vermont which legislated an increase from four laws in 2014 to 18 laws in 2022, a 350% increase.
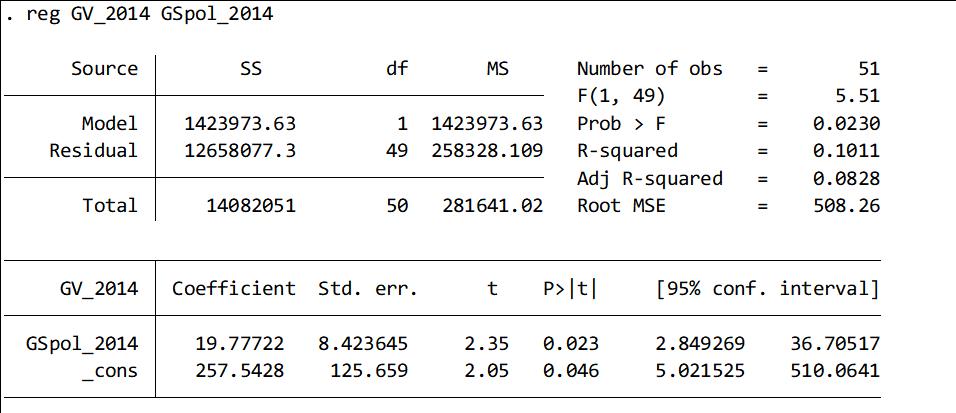
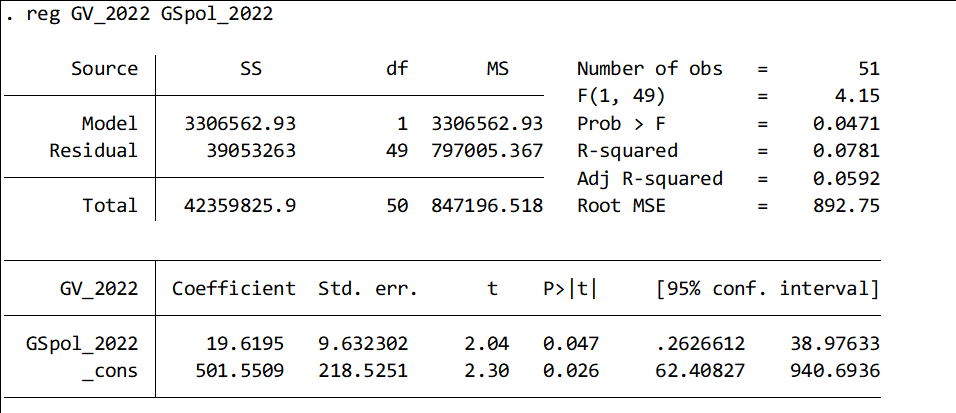
For this model, I first regressed the dependent variable “gun violence rate in 2014” with the explanatory variable “gun safety policies in 2014,” followed by the same regression for 2022 numbers. Both of these models were statistically significant at an alpha of .05 with the 2014 model showing an R-squared of .1011 and the 2022 model an R-squared of .0781. The coefficient on gun safety policies was nearly identical for both years at a value of 19.777 for 2014 and 19.62 for 2022, indicating an increase of a little less than 20 incidents of gun violence for every gun safety measure enacted for both years, the similar coefficients indicating a steady state of gun violence despite the growth of gun safety policies.

Regressing Gun Violence rates in 2014 with Gun Safety Laws in 2014.
Regressing Gun Violence rates in 2022 with Gun Safety Laws in 2022.
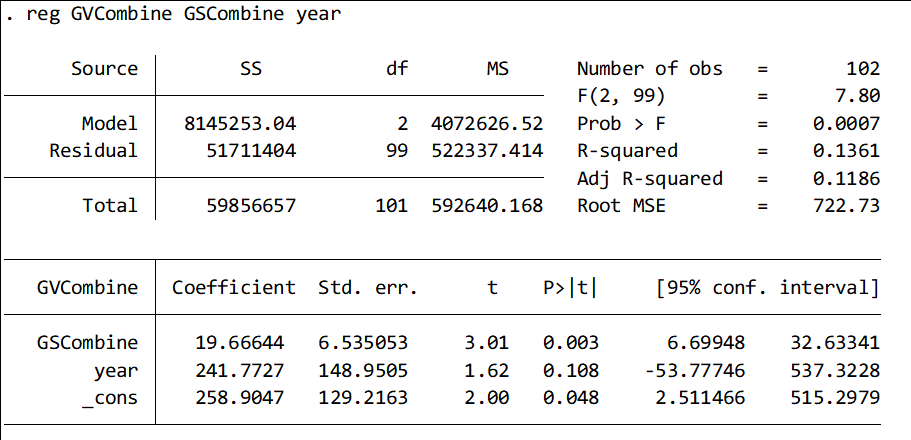
To further test this, I stacked both gun violence incidents and gun safety laws for both years and regressed those stacks with a dummy variable called “year” with a zero representing 2014 and a one for 2022. This model returned an almost identical value on the gun safety coefficient with a value of 19.666. The coefficient on the dummy variable was 241.77. The positive coefficient indicates that gun violence levels in 2022 (dummy=1) are higher by 241.77 cases compared to 2014 levels (dummy=0 baseline) after controlling for differences in gun safety laws, suggesting that gun violence has increased from 2014 to 2022 by around 242 shootings, holding gun laws constant in the model. The size of 242 cases is a meaningful effect size indicating rising gun violence post-2014.
The combined model had an overall P-value of 0.0007, and the P-value of the combined gun safety explanatory variable was 0.003. The model and the explanatory variable are both statistically significant, and the R-squared for the stacked model is 0.136, indicating that gun safety laws explain 13.61% of the variation in gun violence. The positive value of the coefficient on gun safety indicates that for every gun control law implemented between 2014 and 2022 approximately 20 additional gun violence incidents were observed. My initial estimate of this coefficient was that it would be a negative value, so these results were surprising. Although it is unlikely that implementing gun safety regulations causes an increase in gun violence rates, and more likely that states with higher gun violence tend to implement more gun control laws, the model is clear that the null hypothesis must be rejected and there is no evidence to support the notion that gun control laws decrease gun violence.
This conclusion was so surprising that I had to regress a few more things by setting up dummy variables first to test if only states that INCREASED gun control laws saw a decrease in gun violence rates, and second to see if states that increased those laws by 25% or more saw a decrease. In these regressions, both of these coefficients on gun safety policies remain positive with almost identical values of ~15, however the P-values at 0.226 and 0.264 respectively show that they are not statistically significant. Either way, we fail to reject the null hypothesis and have to state that there is no evidence to support the notion that gun control legislation adversely impacts gun violence rates as was anticipated.
Model 3
In model three I wanted to see if states that have implemented Constitutional Carry laws have seen an increase in gun violence incidents over states that have not done so. Constitutional Carry is defined as the rights of the citizens of a state to carry a concealed firearm without a permit. Prior to 2014 only five states granted their citizens this right (AK, AZ, AR, VT, WY). The remaining 45 states had varying laws between “shall issue,” the requirement that providing a citizen isn’t statutorily prohibited from having or carrying a firearm, the state must provide a concealed carry license, which may require testing and training, and “may issue,” which leaves the decision to issue the license up to the discretion of the issuing authority in the state, typically the county sheriff. In “may issue” states, the applicant is typically required to provide supporting evidence to show that they have an actual need to be armed, along with character references and possibly additional documentation that shows good character, while in “shall issue” states the applicant must only pass the background check and occasionally the requirement to attend classroom training and qualification testing on a gun range.
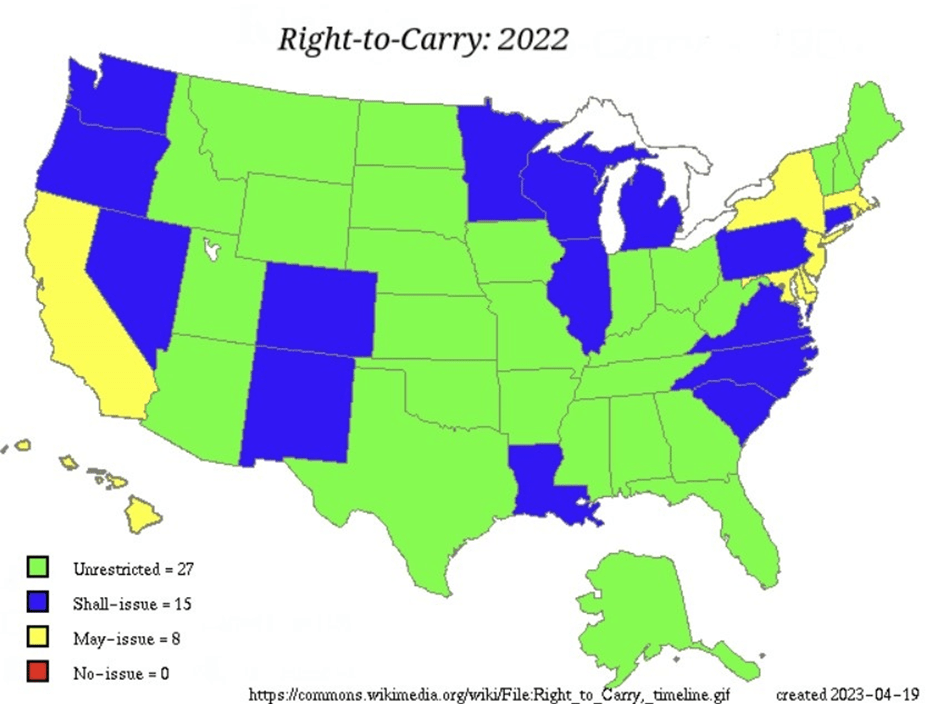
Between 2014 and 2022, twenty additional states changed their laws from either shall issue or may issue to Constitutional Carry, removing the licensing requirements entirely. Two additional states have added this law here in 2023, but since this dataset is for 2022, those states were removed from this model. It should also be noted that the only remaining “may issue” states today are Connecticut and Delaware, and both of them are likely to be forced to remove this discretionary aspect due to the Supreme Court case NYSRPA v. Bruen in 2022 in which the New York State Rifle and Pistol Association challenged the state of New York’s “may issue” law. The Supreme Court held that New York’s 1911 Sullivan Act requiring concealed carry applicants to show “proper cause” to apply for a license was a violation of the rights granted under the Second Amendment (Root, 2022). Prior to this case in 2022, eight states were “may issue” states, and in 2022 there were a total of 27 states with Constitutional Carry laws.
The addition of 20 states to list of Constitutional Carry states between 2014 and 2022 made for an interesting database to determine the effect of this important change of law on the rates of gun violence. Advocates of Constitutional Carry insist that criminals have always carried concealed firearms without regard for the law, and hurdles that make it more difficult for law-abiding citizens to acquire a concealed carry license serves no lawful purpose. Many also insist that law-abiding citizens having concealed firearms will cause criminals to reconsider violent crimes and lessen the potential victim pool. Detractors of these laws claim that adding more firearms to the streets will only increase gun violence incidents. My estimate was that the former was most likely to be true, thus the negative anticipated sign of the coefficient.
For this model, I was interested in the growth rate of gun violence between 2014 and 2022 in those states with Constitutional Carry and those without. I created the dependent variable (logdiffGV) which is the natural logarithm of the difference between gun violence in 2014 and gun violence in 2022, and the independent variable (logGV14) which is the natural logarithm of gun violence in 2014. I then created a dummy regressor variable for the 20 states that added Constitutional Carry during the same time period, using one for those CC states and zero for the 30 states (plus Wa. D.C.) that either already had Constitutional Carry, implemented it in 2023, or do not recognize this still today. The regression results show a coefficient of .009385 on the independent variable (logGV14) indicating that controlling for states with Constitutional Carry, gun violence has increased by less than 0.1%, meaning that while there has been an increase in gun violence in these states over states without Constitutional Carry, the magnitude of the increase is miniscule. The 95% confidence interval for this coefficient is -.0497 to .0685, and the P-value is 0.743, indicating that the regressor is not statistically significant at any level of alpha, nullifying any definitive conclusion.

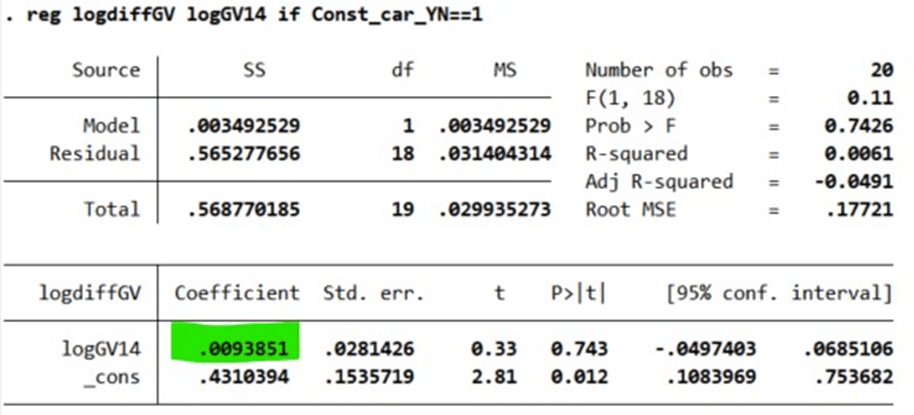
The dismally low R-squared of 0.0061 with an adjusted R-squared of -0.0491 shows that not only is the variable not statistically significant, Constitutional Carry laws have little to no explanatory power for the explosive growth of gun violence between 2014 and 2022. In conclusion, there is no evidence to support the notion that Constitutional Carry laws have any impact (positive or negative) on gun violence rates.
Model 4
The final regression model for this analysis is the full model with all explanatory variables and the rate of gun violence per capita in 2022 as the dependent variable. This model uses the three key variables I identified (gun safety policies in 2022, the poverty rate per capita, and the rate of concealed carry permits or Constitutional Carry) as well as the three lessor explanatory variables (population density, the per capita rate of mental illness, and the unemployment rate). The model has an overall significance level of three stars with a P-value of 0.0005, making the model statistically significant at all levels of alpha. The R-squared for the overall model is 0.4346 indicating that this model explains about 43.5% of the variation in gun violence per capita.
Gun safety policies in 2022, the poverty rate, population density, and the rate of concealed carry permits all have positive coefficients, while the unemployment rate and the dummy variable for Constitutional Carry have negative coefficients. The only variable that is statistically significant at any level of alpha is the poverty rate with a P-value of 0.000. The poverty rate also has the largest positive value at 1.824, indicating that for every unit increase in the poverty rate there is a 1.824 unit increase in the rate of gun violence. Since this variable is the only one that is statistically significant, the poverty rate is the most reliable indicator of gun violence per capita in all states for the explanatory variables in this model.

Data and Descriptive Statistics
Table 2

Table 2 shows the descriptive statistics of the variables used in the preceding regressions. The observations for all variables numbers 51—the 50 U.S. states plus the District of Columbia. An important note about the statistics for the District of Columbia. Washington D.C. is the most population dense variable and also has the highest rate of gun violence per capita, by far. These numbers were so much larger than the next closest number that they were actually outliers in the data. In order to avoid having these outliers adversely impact the standard errors, it was necessary to treat these outliers. There are several scientifically legitimate ways to deal with outliers, and the method I chose was Winsorization—reducing the outliers to their next largest values. The true values for gun violence per capita for Washington D.C. is 105.388. This was reduced to the next largest value, that of Louisiana at 37.05. The true value for the population density of Washington D.C. is 11295 persons per square mile, and this value was reduced to the value for the next largest, New Jersey at 1263 persons.
Table 3
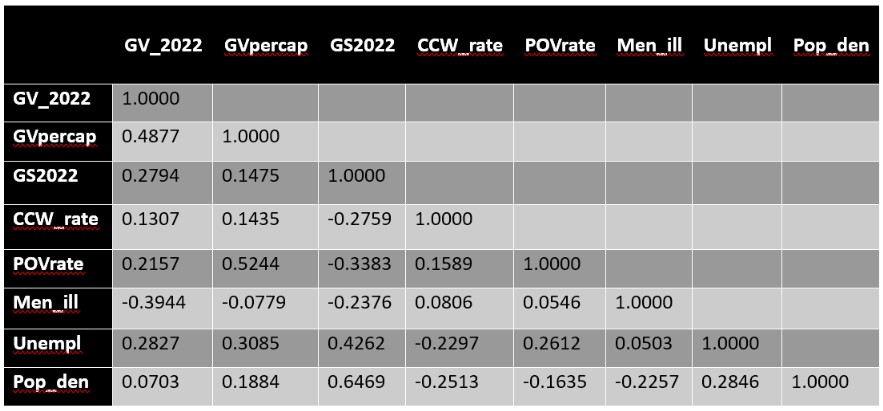
Table 3 is a matrix of correlation coefficients with the primary explanatory regressors used for this analysis. There are several correlation coefficients that are of interest in this matrix. The first is the correlation between gun violence in 2022 (GV_2022), and gun violence per capita in 2022 (Gvpercap). If gun violence was equally spread amongst the states, we would expect perfect correlation between these two regressors, however, the correlation is only 0.4877, indicating that gun violence is somewhat concentrated in some states regardless of population. Another measurement of interest is the correlation between gun violence in 2022 (GV_2022), and the number of gun safety policies embedded into law in 2022 (GS2022). As gun safety laws increase, we hope to see gun violence rates falling, a correlation that would result in a negative number, but here we see a positive correlation, indicating that increased gun safety policies are associated with increased gun violence.
The largest correlation present is with the poverty rate per capita (POVrate) and gun violence per capita in 2022 (Gvpercap). This correlation of 0.5244 would seem to indicate that poverty and gun violence go hand-in-hand, a result that is perhaps not too surprising, but interesting nonetheless. A final item of interest in this correlation matrix is the negative coefficient on the correlation between the number of mentally ill persons per capita (Men_ill) and gun violence in 2022 (GV_2022). This negative number would seem to indicate that increased mental illness is associated with a decrease in gun violence, the opposite of what we might expect. It’s possible that gun laws prohibiting access to firearms by those diagnosed with a mental illness may be effective in curbing a measurable amount of gun violence.
Scatterplots
Scatterplot 1: gun violence per capita and gun safety policies
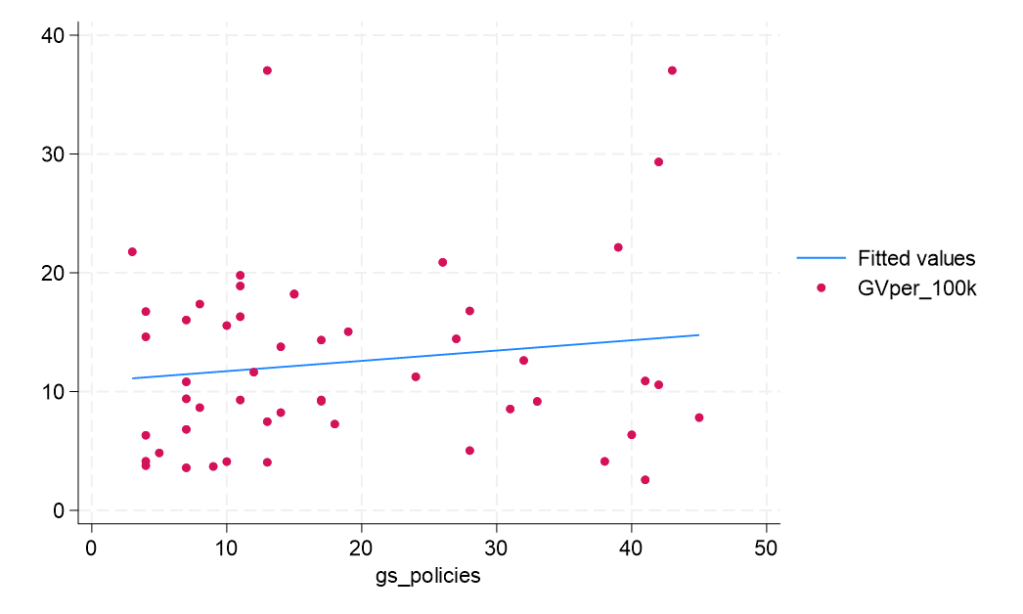
Scatterplots provide a visual depiction of the correlation coefficients matrix. In scatterplot 1, the fitted regression line shows the very slight positive correlation with states that have implemented more gun safety policies seeing higher incidents of gun violence per capita.
Scatterplot 2: gun violence per capita and the poverty rate

Scatterplot 2 shows a strong, positive correlation between the poverty rate and gun violence per capita. This fitted regression line depicts this highly correlated pair, with a small standard error evident in the closely spaced data points.
Scatterplot 3: gun violence per capita and population density
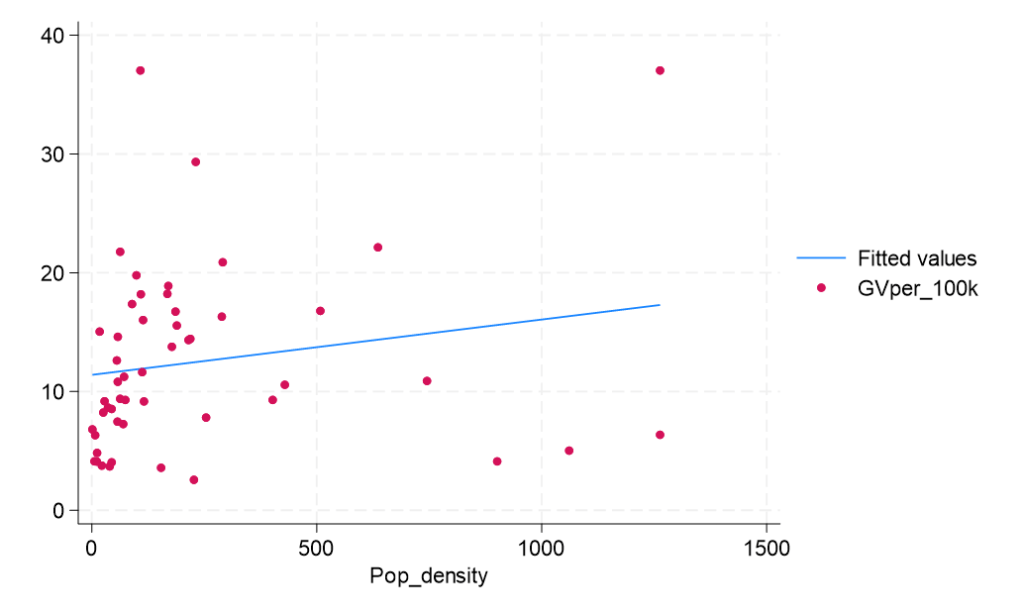
In scatterplot 3, we see the slight positive correlation between the population density and gun violence per capita. There’s a lot of room in America, and as such, the 51 observations are congregated toward the left of the chart. However, there is a clear upward trend in the datapoints that shows that although it’s a small correlation, higher population densities are associated with higher incidents of gun violence.
Scatterplot 4: gun violence per capita and the concealed carry permit rate

This scatterplot shows the results of the correlation between the rate of concealed firearm carry permits issued and the rates of gun violence per capita. This data may be somewhat misleading or unreliable due to the number of states that don’t require a permit to carry a concealed firearm. Since 2014, 22 states have dropped the requirement of its citizens to endure the process of applying for a permit, allowing concealed carry without any permit.
Scatterplot 5: gun violence per capita and the rate of mental illness

Scatterplot 5 shows the surprising results of the correlation between mental illness and gun violence per capita. My initial anticipation for this regressor was that mental illness would have a positive correlation with gun violence, but this scatterplot clearly shows the reverse is true. Higher incidents of confirmed mental illness are consistent with declining rates of gun violence, a result that may be consistent with the vast majority of states prohibiting gun ownership to anyone diagnosed with serious mental health issues.
Scatterplot 6: gun violence per capita and the unemployment rate
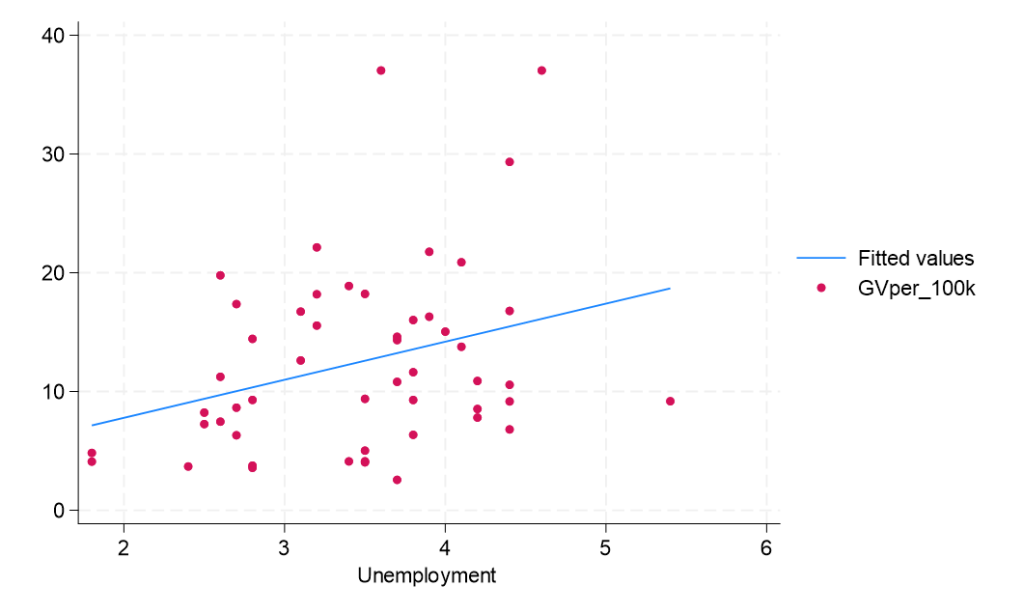
With a positive correlation between the poverty rate and gun violence, it should come as no surprise that we see a similar positive correlation between unemployment and gun violence. Scatterplot 6 depicts that correlation, a medium correlation but undeniably positive.
Empirical Results
Table 4
In table 4 I’ve taken the regression results from the full model (model 4) and placed the explanatory variables into a table to more easily view and understand their values and the meanings and implications of those values.

From this table, it’s easy to see that my initial expectations were vastly different from a few of the results. I fully expected higher numbers of gun safety policies to result in lower incidents of gun violence, but from the coefficient, it’s clear that this is not the case. The rate of concealed carry also shows a different than expected sign, however, I was initially ambivalent about those results as I could see merit in the argument of both gun control advocates and Second Amendment defenders as to how allowing more guns into the public could affect gun violence. For the rate of mental illness and the unemployment rate, I anticipated those to both have a positive correlation toward gun violence with incidents rising as those rates increased, but it’s easy to see that this data shows the opposite, albeit with P-values well outside the bounds of any acceptable statistical significance.
There were 51 observations for this model, all 50 U.S. states plus Washington D.C. The model has an R-squared of 0.4346 indicating that it explains a little more than 43% of the variation in gun violence rates amongst the states. The calculated F-value is 4.72, and the probability of observing a value greater than F is 0.0005 making this model statistically significant at an alpha of 0.01 (three stars).
Conclusion
The purpose of this paper was to examine the alarming increase in gun violence over the past decade and attempt to identify some of the causes of that increase. America is diametrically divided over guns and the root causes of gun violence, particularly the mass shootings that make up such a small percentage of gun violence but capture so much of the attention of the American psyche. Political narratives and talking pundits have only served to further entrench the often mistaken or uneducated viewpoints of the majority of Americans, and social media has become a cesspool of screaming, faux intellectual idealogues who are convinced that their viewpoint is the correct one, despite the nuance of this incredibly complex problem.
Are guns the root cause of gun violence? Well, sure, the same way that cars are the root cause of fatal automobile accidents. The solution to the problem of auto-related fatalities is not to get rid of cars because our society relies too heavily on rapid and reliable transportation to possibly justify eliminating them. And the solution to the problem of firearm violence is not to get rid of guns. Not because we need them, but because we absolutely can not get rid of them. The United States of America is founded on the principles of a Constitution and a Bill of Rights that grants certain rights to its people. The Second Amendment guarantees U.S. citizens the right to “keep and bear arms,” and the political divisions in this country ensure that this amendment will not be repealed in the foreseeable future. In addition, firearms outnumber people in this country. This is what makes laws that attempt to reduce firearm access or ownership so futile. None of these things are going to change, regardless of efforts or attempts to do so. It’s only when we understand and accept that fact that we can attempt to make meaningful progress toward reducing gun violence.
With this research paper, I wanted to take an unbiased approach to the causes of gun violence. Although I have personal biases regarding this subject, as do most people, I did my utmost to set them aside and compile unbiased data and come up with hypotheses that were completely objective. I was fully prepared to discover that gun control laws decrease gun violence, or that Constitutional Carry laws are associated with increased firearm fatalities. The data was derived from unimpeachable sources that are highly respected by both political divides, and I did my best to fact-check or cross-verify every source that I used.
The key finding of this paper is a difficult one for many to accept—gun safety laws do not have a meaningful negative impact on gun violence rates, despite what politicians may claim. Other findings may be surprising as well. Constitutional Carry states, and states with higher numbers of concealed carry permit holders do not see a statistically significant increase or decrease in rates of gun violence. Mental illness rates are not a reliable indicator of gun violence, and in fact, increased mental illness is associated with decreased levels of gun violence. Finally, the most important finding, and the only one that was statistically significant in every regression ran, higher poverty rates per capita are associated with sharp increases in gun violence rates.
One surprising state that has done a great job in controlling the rate of gun violence is California. In 2022, California had a gun violence per capita (100k people) of 7.812. This puts them at 14th in the country, and since 2014, California has seen an increase in gun violence of 47.7%, far below the national average of 74.5%. California also has the most gun control laws of any state in the union at 45. Politicians like Governor Newsom love to soapbox these stats and claim a correlation along with causation, but the results of this study make it clear that increased gun laws are not associated with decreased gun violence. However, it is clear that California is doing something right when it comes to gun violence. The poverty rate in California is 12.58%, putting them right at the national average of 12.595%, so lower poverty is not the cause of California’s gun violence success. It would be a wonderful surprise if the politicians of that state would decide to actually look at the facts and the data and determine what it is they are actually doing right instead of grandstanding with performative speeches associating their highest-in-the-nation gun control laws with lower rates of gun violence.
Washington D.C. has so much gun violence that the number was an outlier that had to be Winsorized to avoid contaminating the regressions. Gun violence per capita in D.C. in 2022 was 105.39, well above the next highest on the list, Louisiana at 37.035. This is in spite of D.C. passing 43 gun control bills, just two fewer than California, and 30 more than gun violence runner-up, Louisiana.
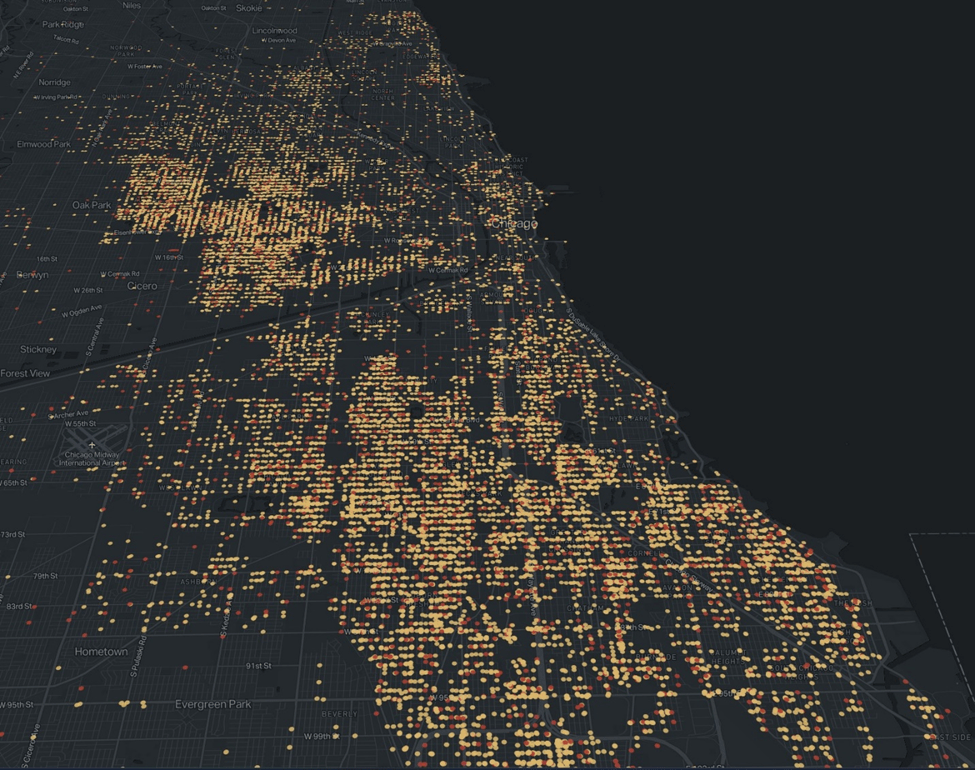
Not all gun violence is equally distributed. Chicago is notorious for its rampant deadly shootings. Illinois has a very high gun violence rate of 29.335 with the third highest number of gun safety laws in the country at 42. But most of Illinois is very safe, with a large percentage of its violence concentrated in Chicago. The gun violence per capita rate in Chicago is higher even than in Washington D.C., at 106.37. This is, however, down from 2021 when the gun violence per capita rate was an eye-popping 128.74. Even in Chicago itself, gun violence is not equally distributed with most incidents congregated in the southside and in the west. This should indicate to us that blanket gun safety laws that are not targeted toward the actual problem can not be expected to solve the problem.
Gun violence in Chicago from 2014-2022. Yellow dots indicate a shooting injury while red dots indicate a shooting death.
I have no doubt that some gun safety laws are useful and, if data could be compiled and regressed successfully on the impact of individual gun control laws, then we could identify the ones that are actually useful in combating gun violence. As of now, with the shotgun approach toward gun legislation, gun safety laws are performative only. They look good to politicians pandering to their liberal bases while accomplishing nothing useful and serving only to distract from any meaningful solution to this deadly problem. My hope is that this paper will serve to disseminate true factual data that will be used to actually combat gun violence and make a meaningful dent in the rising problem. In addition, we need to gather more and better data. Data on gang affiliation is spotty at best or doesn’t exist at worse. I suspect that much gun violence is gang related, but without that data, we can not make meaningful decisions or implement regulations that have a meaningful impact. Domestic violence is another area where I suspect much gun violence results. Although police departments are supposed to identify domestic violence incidents, this often doesn’t happen. While researching the data for this paper, I found many incidents where the association with domestic violence was listed as “unknown.” Clicking on the incident and reading the details, I found numerous incidents that were clearly DV related despite the “unknown” tag, and this is an important statistic. If any gun violence law is going to have a meaningful impact on gun violence rates, it would seem that keeping them out of the hands of convicted domestic abusers would be crucial, but we can’t know this for certain without solid and reliable data. Police departments need to ensure that this type of data is accurate at a much higher rate than it currently is. This type of data would assist in future analysis into the determinants of gun violence, and would allow policymakers to make meaningful changes to impact this persistent and deadly problem.
References:
Number of gun safety policies adopted per state:
https://sightmark.com/blogs/news/states-ranked-by-how-strict-their-gun-laws-are
Number of gun safety polices historical numbers:
Adult prevalence of mental illness:
Population rates for 2022:
https://en.wikipedia.org/wiki/List_of_U.S._states_and_territories_by_population
Historic population rates:
Number of shootings and deaths:
https://www.gunviolencearchive.org
https://www.thetrace.org/2023/02/gun-violence-map-america-shootings
Poverty Rates:
https://en.wikipedia.org/wiki/List_of_U.S._states_and_territories_by_poverty_rate
Population density:
Concealed and permitless carry data:
Gang stats:
https://www.fbi.gov/file-repository/stats-services-publications-national-gang-report-2015.pdf/view
Unemployment data:
https://www.bls.gov/information-guide/home.htm
Data on firearm violence from 1993 to 2011:
Suicide rates:
Suicide rates by state:
https://www.cdc.gov/nchs/pressroom/sosmap/suicide-mortality/suicide.htm
US population growth by year
Gun policy research review:
https://www.rand.org/research/gun-policy/analysis.html
Gun death information
Other gun violence studies referenced:
Effects of Concealed-Carry Laws on Violent Crime – Rand Corp, Jan 2023
https://www.rand.org/research/gun-policy/analysis/concealed-carry/violent-crime.html
Paper on firearm ownership and correlation to homicide rates, Siegel, Ross, King:
https://ajph.aphapublications.org/doi/full/10.2105/AJPH.2013.301409
Gius 2014 study on shall issue states
https://rss.onlinelibrary.wiley.com/doi/full/10.1111/j.1740-9713.2014.00732.x
Lott and Mustard 1997
https://www.journals.uchicago.edu/doi/abs/10.1086/467988
Ian Ayres, John Donohue 2003
Wikipedia article on NYSRPA v. Bruen 2022
Root, Damon. June, 2022. Reason.com. “SCOTUS Affirms Right To Carry a Handgun for Self-Defense Outside the Home.” https://reason.com/2022/06/23/in-landmark-2nd-amendment-ruling-scotus-affirms-right-to-carry-a-handgun-for-self-defense-outside-the-home/